Image Details
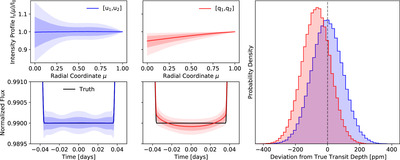
Caption: Figure 1.
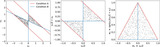
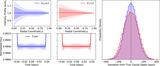
Impact of the choice of limb darkening on the light curve fit and measured transit depth for the case of no limb darkening and photometric scatter of σ = 1000 ppm. Top left: median stellar intensity profile I s(μ)/I 0 (blue line) from the transit fit to the simulated observations using the [u 1, u 2] limb-darkening parameterization. The 1σ and 2σ confidence intervals are shown by the shaded regions. Bottom left: median transit model (blue) obtained from the transit fit with the [u 1, u 2] limb-darkening parameterization. The 1σ and 2σ confidence intervals are shown by the shaded regions. Top middle: same as top left considering the [q 1, q 2] parameterization. Bottom middle: same as bottom left considering the [q 1, q 2] parameterization. Right: Probability density distributions of the measured transit depth minus the true transit depth for the [u 1, u 2] (blue) and [q 1, q 2] (red) parametrizations. The transit depth measured using [u 1, u 2] is centered on the expected value, whereas the one measured using [q 1, q 2] peaks at a smaller value.
Other Images in This Article
Copyright and Terms & Conditions
© 2024. The Author(s). Published by the American Astronomical Society.