Image Details
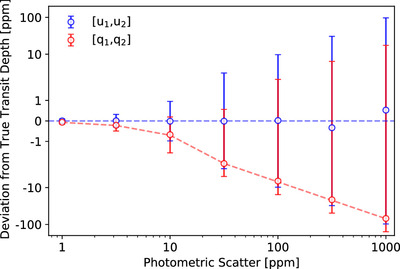
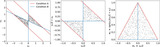
Caption: Figure 2.
Magnitude of the bias on the measured transit depth as a function of photometric scatter. The data points show the deviation from the true transit depth, along with the 1σ uncertainty, as a function of photometric scatter for both the [u 1, u 2] and [q 1, q 2] parametrizations. We use a symmetric log scale for the y-axis. Contrastingly from the [u 1, u 2] parameterization, the [q 1, q 2] parameterization shows an increasing bias of the transit depth when going toward larger scatter. The blue dashed line corresponds to no bias on the transit depth, with the measured transit depths obtained using the [u 1, u 2] parameterization following that trend. The bias on the transit depth when using the [q 1, q 2] parameterization closely follows the red dashed line, which traces the trend ﹩y=-\sqrt{2/\pi }\,{\sigma }_{t,d}﹩, where σ t,d is the measured transit depth uncertainty.
Other Images in This Article
Copyright and Terms & Conditions
© 2024. The Author(s). Published by the American Astronomical Society.