Image Details
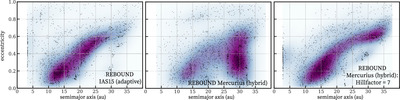
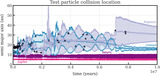
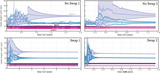
Caption: Figure 7.
Semimajor axis–eccentricity density plots for Neptune representing the evolution of a chaotic system as simulated with different integrators. For each integrator, 500 simulations were run with orbital elements recorded every 1000 yr. The orbital elements across all 500 simulations were compiled for each planet into one large pool of data. From this, 2000 points were randomly selected (black dots), so that we were sampling from a range of all simulations. The end result is the distribution at any given time, with increasing density as darker purple. This compares REBOUND’s IAS15 with the Mercurius default (Hillfactor = 3), and adjusted to a larger switchover radius (Hillfactor = 7).
Other Images in This Article
Copyright and Terms & Conditions
© 2024. The Author(s). Published by the American Astronomical Society.