Image Details
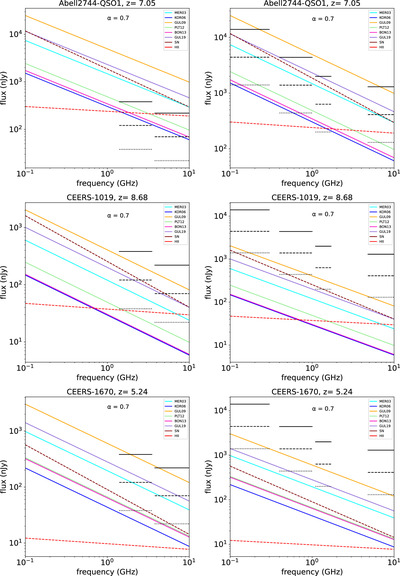
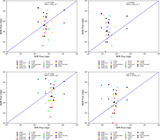
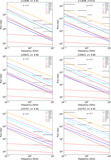
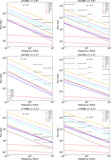
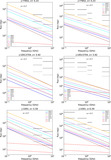
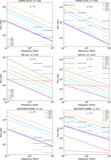
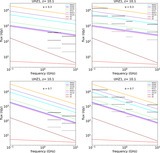
Caption: Figure A9.
Radio flux densities for AGNs observed in CEERS, JADES and UNCOVER for α = 0.7 with detection limits for ngVLA (left column) and SKA (right column). The dotted, dashed and dotted–dashed red and brown lines are H II region and SN flux densities for SFRs of 1, 3 and 10 M ⊙ yr−1, respectively. The black solid, dashed and dotted horizontal bars show ngVLA limits for integration times of 1, 10 and 100 hr, respectively.
Other Images in This Article
Show More
Copyright and Terms & Conditions
© 2024. The Author(s). Published by the American Astronomical Society.
Copyright ©
2026 Astronomy Image Explorer. All Rights Reserved.