Image Details
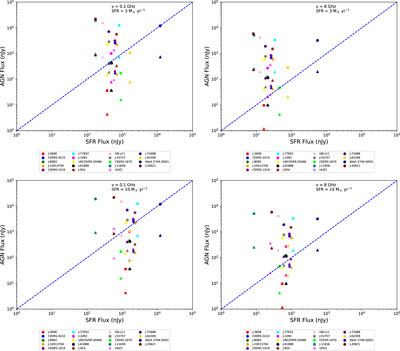
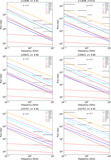
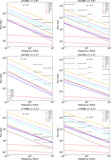
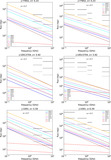
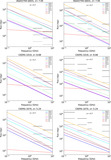
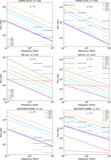
Caption: Figure 4.
The AGN radio flux vs. the expected flux from the host galaxy (which includes both contributions from H II regions and SN remnants) for α = 0.3. The dot symbols show the highest flux from FPs and triangles represent the lowest flux expected from FPs at given frequencies of 0.1 and 8 GHz. The sources for which SFRs are unknown, we assume fixed values of 3 and 10 M ⊙ yr−1 while for other sources SFRs are listed in Table 1.
Other Images in This Article
Show More
Copyright and Terms & Conditions
© 2024. The Author(s). Published by the American Astronomical Society.
Copyright ©
2026 Astronomy Image Explorer. All Rights Reserved.