Image Details
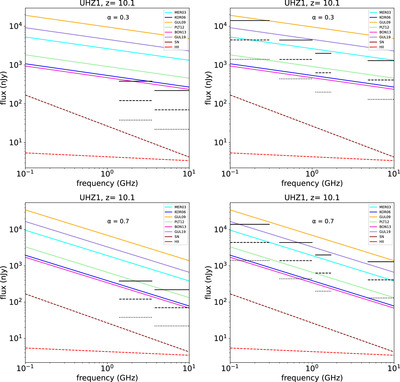
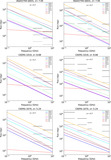
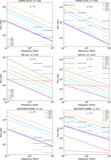
Caption: Figure A1.
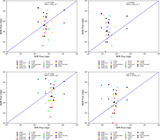
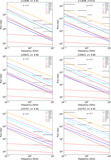
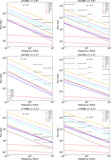
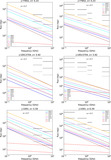
Radio flux densities for UHZ1 for α = 0.3 (top row) and 0.7 (bottom row) with detection limits for ngVLA (left column) and SKA (right column). The dotted, dashed and dotted–dashed red and brown lines are H II region and SN flux densities for SFRs of 1, 3 and 10 M ⊙ yr−1, respectively. The black solid, dashed and dotted horizontal bars are H II region and SN flux densities for SKA and ngVLA limits for integration times of 1, 10 and 100 hr, respectively.
Other Images in This Article
Show More
Copyright and Terms & Conditions
© 2024. The Author(s). Published by the American Astronomical Society.
Copyright ©
2026 Astronomy Image Explorer. All Rights Reserved.