

Image Details
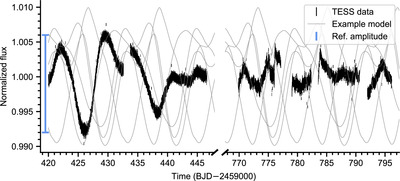
Caption: Figure 5.
The TESS 120 s light curve of HD 189733 A. TESS data from Sectors 41 and 54 (black) are shown alongside five examples of rotational light curves produced with fleck (gray) for spot radii of 0.05 R s . The blue bar gives the maximum peak-to-peak amplitude of the observed rotational modulation. We stress that the aim of this analysis is not to fit the evolving light curve entirely but to constrain probabilistically the spot properties consistent with the maximum TESS rotational amplitude. Transits of HD 189733 b have been masked.
Other Images in This Article
Copyright and Terms & Conditions
© 2024. The Author(s). Published by the American Astronomical Society.

Copyright ©
2026 Astronomy Image Explorer. All Rights Reserved.
