

Image Details
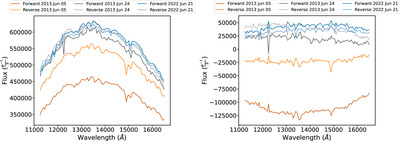
Caption: Figure 1.
Left: median spectra divided by the exposure time for each scan direction observed flux within each observation date data set. Right: median spectra divided by the exposure time for each scan direction observed flux subtracted by the overall (six spectra) mean spectra within each observation date data set. Error bars for each spectra are smaller than the width of the lines. The left figure highlights the offset between the six scan observation spectra. Similarly, the right figure identifies the difference in curvature between the observed spectra, suggesting that a multiplicative scale factor is employed in the model spectra formulation (Equation (1)).
Other Images in This Article
Copyright and Terms & Conditions
© 2024. The Author(s). Published by the American Astronomical Society.

