

Image Details
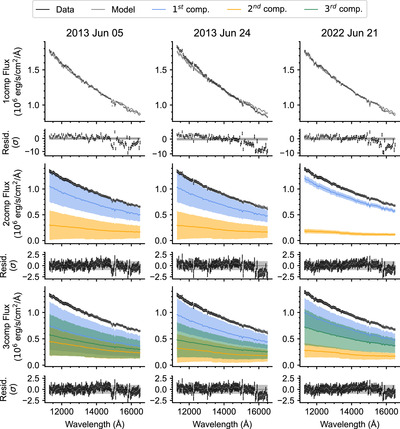
Caption: Figure 3.
1comp (top row), 2comp (middle row), and 3comp (bottom row) posterior data and models for the 2013 June 5 (left column), 2013 June 24 (middle column), and 2022 June 21 (right column) HST reverse scan observations of HD 189733 A. Spectra are given in units of flux at the stellar surface. The flux level varies between models because the conversion from raw counts depends on the free parameter a scale. Notably, the simplest 1comp retrievals settle on a distinct value of a scale in order to optimize the fit to the spectral slope with a single spectral component. In addition to the mean (gray line) and standard deviation (gray shaded region) of total model flux, contributions from individual spectral components are shown as colored lines (means) and shaded regions (standard deviations). Below each panel with spectral fluxes, another panel shows the residuals between the data and models in units of the standard deviation of the set of posterior models. Over all observation dates, the 2comp model fits the data better than the 1comp model, while the 3comp model does not significantly improve the fit. Note that the higher precision of the 2022 June 21 observations leads to better constraints on the contributions from the individual components (right middle panel).
Other Images in This Article

Copyright and Terms & Conditions
© 2024. The Author(s). Published by the American Astronomical Society.

