Image Details
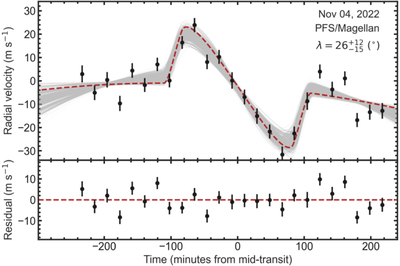
Caption: Figure 2.
PFS observations of the TOI-2202 b Rossiter–McLaughlin effect from UT 11/4/22, together with the associated uncertainties and best-fitting model (red dashed line). Two thousand Rossiter–McLaughlin model draws from the posterior distribution are shown in gray. Residuals from the best-fitting model are provided in the lower panel.
Other Images in This Article
Copyright and Terms & Conditions
© 2023. The Author(s). Published by the American Astronomical Society.
Copyright ©
2025 Astronomy Image Explorer. All Rights Reserved.