Image Details
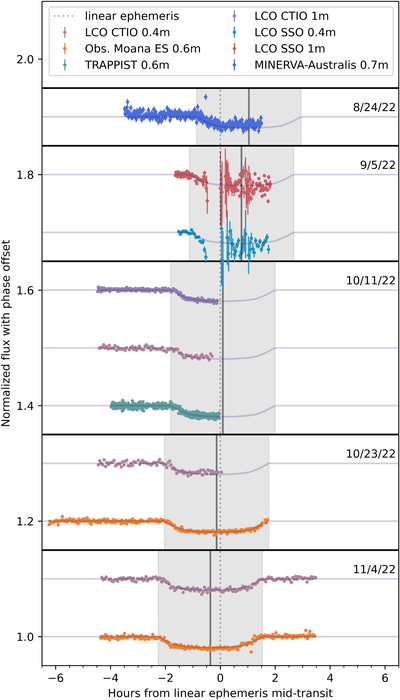
Caption: Figure 1.
Photometry obtained from the seven telescopes used within this work. Observations are ordered by the date on which they were taken, with shaded regions signifying the modeled transit durations and solid gray lines denoting the transit midtimes measured for each dataset. The transit models associated with our parameter solution are shown together with the data, and a dotted line marks the linear ephemeris midtransit. The dataset behind this figure is provided in the digital version of this manuscript.
(The data used to create this figure are available.)
Other Images in This Article
Copyright and Terms & Conditions
© 2023. The Author(s). Published by the American Astronomical Society.
Copyright ©
2025 Astronomy Image Explorer. All Rights Reserved.