Image Details

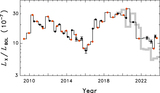
Caption: Figure 5.
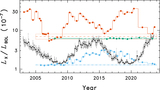
Differential light curves of α Cen AB and Procyon for high-S/N chromospheric and subcoronal emissions (black filled circles), the two Fe XII forbidden lines (green), and X-rays (red). Tracings are shifted vertically for clarity. Each time series was separately normalized to the average of the values between the vertical dashed lines. Horizontal lines mark the zero levels. Error bars of the weak Fe XII lines are shown explicitly for (σ L / < f L > ) ≥ 10 %. “1355” refers to chromospheric O I; “1549” refers to subcoronal C IV.
Other Images in This Article
Copyright and Terms & Conditions
© 2023. The Author(s). Published by the American Astronomical Society.