Image Details
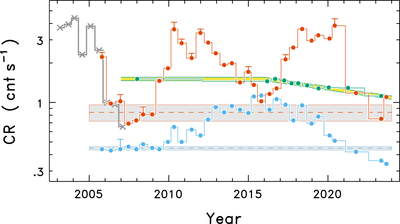
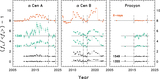
Caption: Figure 2.
Time series of Chandra HRC-I CRs of α Cen A (blue filled circles), α Cen B (red), and Procyon (green). One-sided error bars (from the flare-filtering method) indicate degree of variability where significant. Gray crosses to the left are averages of XMM-Newton CRs of B, scaled to HRC-I. The slanted yellow line corresponds to a decline of 3.5% per year post-2016 for Procyon.
Other Images in This Article
Copyright and Terms & Conditions
© 2023. The Author(s). Published by the American Astronomical Society.
Copyright ©
2025 Astronomy Image Explorer. All Rights Reserved.