Image Details
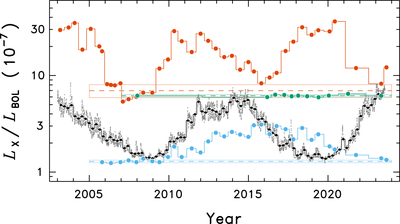
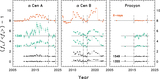
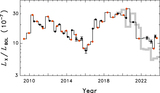
Caption: Figure 3.
Time series of sensitivity-corrected, calibrated X-ray fluxes (0.1–2.4 keV) of α Cen AB and Procyon (same color-coding as in Figure 2), expressed as L X/L BOL. Small gray points represent daily solar X-ray irradiances over the declining phase of sunspot Cycle 23 (left side), the whole of Cycle 24 (middle), and the rise of current Cycle 25 (right side). Black filled circles are 81-day averages (three rotations).
Other Images in This Article
Copyright and Terms & Conditions
© 2023. The Author(s). Published by the American Astronomical Society.
Copyright ©
2025 Astronomy Image Explorer. All Rights Reserved.