Image Details
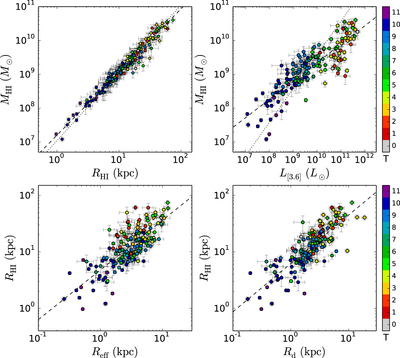
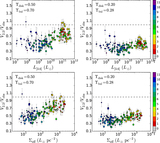
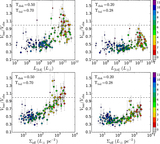
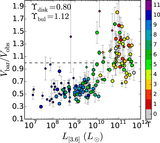
Caption: Figure 3.
Stellar-H I scaling relations. Galaxies are color-coded by Hubble type. In each panel, the dashed line shows a linear fit. Top left: MH I vs. RH I . The dotted line shows the expected relation for H I disks with a constant mean surface density of 3.5 M⊙ pc−2. Top right: MH I vs. L[3.6]. The dotted line shows M⋆ = Mgas for ϒ⋆ = 0.5 M⊙/L⊙. Bottom: RH I vs. Reff (left) and Rd (right).
Other Images in This Article

Copyright and Terms & Conditions
© 2016. The American Astronomical Society. All rights reserved.
Copyright ©
2026 Astronomy Image Explorer. All Rights Reserved.