Image Details
Caption: Figure 5. Mass models for two SPARC galaxies adopting ![]() disk = 0.5 M⊙/L⊙ and
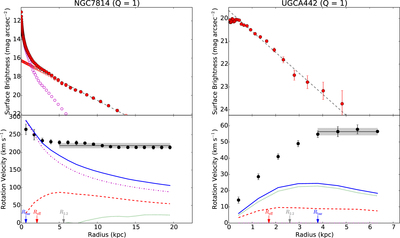
disk = 0.5 M⊙/L⊙ and ![]() bu = 0.7 M⊙/L⊙. Top panels show the [3.6] surface brightness profiles (red dots) and exponential fits to the outer stellar disk (dashed line). Open circles show extrapolated values for bulge (purple) and disk (red) components. Bottom panels show the observed rotation curves (black dots) and the velocity contributions due to gas (green dotted line), stars (red dashed line), bulge (purple dot-dashed line), and total baryons (blue solid line). The arrows indicate three characteristic radii: 2.2Rd (gray), Reff (red), and Rbar (blue). The gray band shows the velocity points used to compute Vf (black solid line), as described in Lelli et al. (2016).
bu = 0.7 M⊙/L⊙. Top panels show the [3.6] surface brightness profiles (red dots) and exponential fits to the outer stellar disk (dashed line). Open circles show extrapolated values for bulge (purple) and disk (red) components. Bottom panels show the observed rotation curves (black dots) and the velocity contributions due to gas (green dotted line), stars (red dashed line), bulge (purple dot-dashed line), and total baryons (blue solid line). The arrows indicate three characteristic radii: 2.2Rd (gray), Reff (red), and Rbar (blue). The gray band shows the velocity points used to compute Vf (black solid line), as described in Lelli et al. (2016).
The complete figure set (176 images) is available in the online journal.
Mass models for two SPARC galaxies adopting ![]() disk = 0.5 M⊙/L⊙ and
disk = 0.5 M⊙/L⊙ and ![]() bu = 0.7 M⊙/L⊙. Top panels show the [3.6] surface brightness profiles (red dots) and exponential fits to the outer stellar disk (dashed line). Open circles show extrapolated values for bulge (purple) and disk (red) components. Bottom panels show the observed rotation curves (black dots) and the velocity contributions due to gas (green dotted line), stars (red dashed line), bulge (purple dot-dashed line), and total baryons (blue solid line). The arrows indicate three characteristic radii: 2.2Rd (gray), Reff (red), and Rbar (blue). The gray band shows the velocity points used to compute Vf (black solid line), as described in Lelli et al. (2016).
bu = 0.7 M⊙/L⊙. Top panels show the [3.6] surface brightness profiles (red dots) and exponential fits to the outer stellar disk (dashed line). Open circles show extrapolated values for bulge (purple) and disk (red) components. Bottom panels show the observed rotation curves (black dots) and the velocity contributions due to gas (green dotted line), stars (red dashed line), bulge (purple dot-dashed line), and total baryons (blue solid line). The arrows indicate three characteristic radii: 2.2Rd (gray), Reff (red), and Rbar (blue). The gray band shows the velocity points used to compute Vf (black solid line), as described in Lelli et al. (2016).
Other Images in This Article

Copyright and Terms & Conditions
© 2016. The American Astronomical Society. All rights reserved.