Image Details
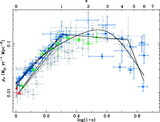
Caption: Fig. 5.
Evolution of stellar mass density buildup inferred from the SFH, assuming (a) SalA IMF (with ﹩R=0.40﹩) and (b) BG IMF (with ﹩R=0.56﹩). The gray shaded and hatched regions come from, respectively, the 1 and 3 σ confidence regions around the SFH ﹩T=4﹩ MeV fits . The details of scaling the data points to our assumed IMFs are given in the text. The open circle is the local stellar density from Cole et al. (2001); the filled circle and filled squares represent the SDSS and FIRES data, respectively, from Rudnick et al. (2003), scaled such that the SDSS measurement is consistent with that from Cole et al. (2001); the open stars are from Brinchmann & Ellis (2000), and the open squares are from Dickinson et al. (2003).
Other Images in This Article
Show More
Copyright and Terms & Conditions
© 2006. The American Astronomical Society. All rights reserved. Printed in U.S.A.