Image Details
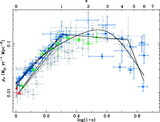
Caption: Fig. 3.
The ﹩\overline{\nu }_{e}﹩ energy spectra predicted for the various SFH fits and temperature assumptions. The solid and dashed curves are the SalA IMF and BG IMF, respectively. The ﹩T=4﹩ and 6 MeV curves are consistent with the SK ﹩\overline{\nu }_{e}﹩ limit. The ﹩T=8﹩ MeV curves are inconsistent with the ﹩\overline{\nu }_{e}﹩ limit, and indicate the shape of the ﹩\overline{\nu }_{e}﹩ spectrum derived by assuming the parametric form for the SFH corresponding to our best fit (﹩T=4﹩ MeV) and setting the ﹩\overline{\nu }_{e}﹩ temperature to the higher value. The thin vertical line marks ﹩E=19.3﹩ MeV, above which the ﹩\overline{\nu }_{e}﹩ contributes to the SK limit.
Other Images in This Article
Show More
Copyright and Terms & Conditions
© 2006. The American Astronomical Society. All rights reserved. Printed in U.S.A.