Image Details
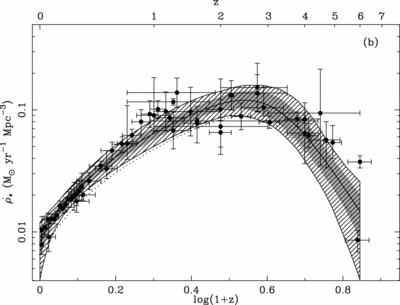
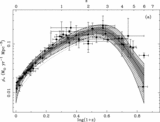
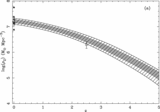
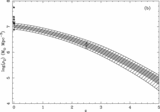
Caption: Fig. 2.
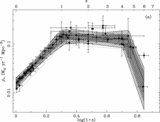
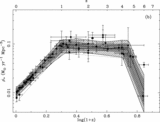
SFR density data used in defining the best‐fitting parametric forms and the resulting fits, assuming (a) SalA IMF and (b) BG IMF. The shape of the fits is determined from the SFH data alone, and a scaling factor is fit to ensure consistency with the SK ﹩\overline{\nu }_{e}﹩ limit (i.e., given the assumed temperature, this quantifies how much lower the SFH normalization has to be so as not to violate the SK limit). Solid lines assume a ﹩\overline{\nu }_{e}﹩ temperature of ﹩T=4﹩ or 6 MeV, and dotted lines, ﹩T=8﹩ MeV. The gray shaded and hatched regions are, respectively, the 1 and 3 σ confidence regions around the ﹩T=4﹩ MeV fits. The scaling factors are (a) 1.0, 1.0, and 0.67 and (b) 1.0, 1.0, and 0.74, respectively, for ﹩T=4﹩, 6, and 8 MeV.
Other Images in This Article
Show More
Copyright and Terms & Conditions
© 2006. The American Astronomical Society. All rights reserved. Printed in U.S.A.