Image Details
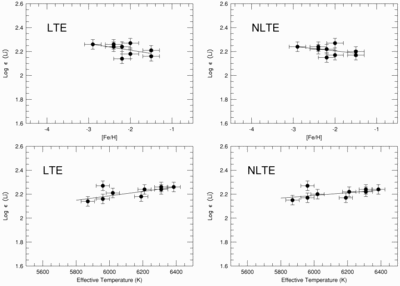
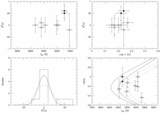
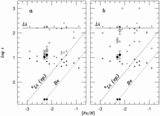
Caption: Fig. 8.
Total Li abundances in the sample. The left panels show log ∊(Li) vs. [Fe/H] (top panels) and Teff (bottom panels) from the LTE analysis. The right panels illustrate the same results but include non‐LTE corrections from Carlsson et al. (1994). The straight lines are linear fits to the trends.
Other Images in This Article
Copyright and Terms & Conditions
© 1998. The American Astronomical Society. All rights reserved. Printed in U.S.A.
Copyright ©
2026 Astronomy Image Explorer. All Rights Reserved.