Image Details
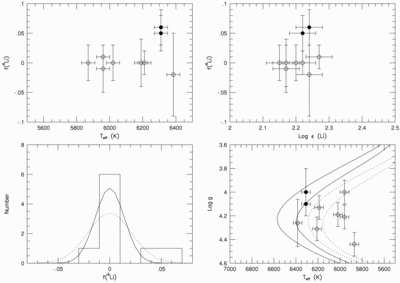
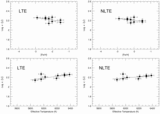
Caption: Fig. 7.
Summary of the results from the Li I line‐profile analysis. The top left panel shows f(6Li) vs. Teff: nondetections are shown by open circles and detections by filled circles. Note that the two detections are near the hotter end of the distribution. The top right panel is f(6Li) vs. total Li abundance, and no trend is seen here. The bottom left panel is the observed histogram of the values of f(6Li). The distribution is peaked sharply around f(6Li) = 0.00, with two positive detections. The continuous curves show two Gaussian distributions with σ = 0.02 and 0.03, respectively. The bottom right panel illustrates the positions of the program stars in the log g–Teff plane (nondetections of 6Li are shown by open circles and detections by filled circles) with isochrones from Bergbush & VandenBerg (1992) shown as continuous curves. The ages are 14 and 18 Gyr, with the solid curve for [Fe/H] = −2.0 and the dashed curve for [Fe/H] = −1.3.
Other Images in This Article
Copyright and Terms & Conditions
© 1998. The American Astronomical Society. All rights reserved. Printed in U.S.A.