

Image Details
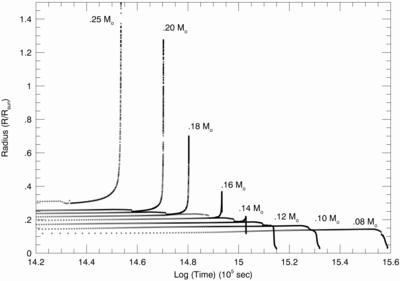
Caption: Fig. 4.
Radius vs. time diagram for stellar models with mass ranging from 0.08 M☉ to 0.25 M☉. In each sequence of models (except for the 0.25 M☉ model) a maximum radius is reached, and at the very latest times plotted, the radius is shrinking.
Other Images in This Article

Copyright and Terms & Conditions
© 1997. The American Astronomical Society. All rights reserved. Printed in U.S.A.

Copyright ©
2026 Astronomy Image Explorer. All Rights Reserved.
