

Image Details
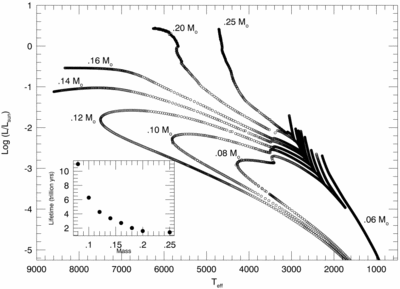
Caption: Fig. 2.
Evolution in the Hertzsprung‐Russell diagram for stars with masses in the range 0.06 M☉ ≤ M* ≤ 0.25 M☉. The inset diagram shows the corresponding main‐sequence lifetimes as a function of stellar mass.
Other Images in This Article

Copyright and Terms & Conditions
© 1997. The American Astronomical Society. All rights reserved. Printed in U.S.A.

Copyright ©
2026 Astronomy Image Explorer. All Rights Reserved.
