

Image Details
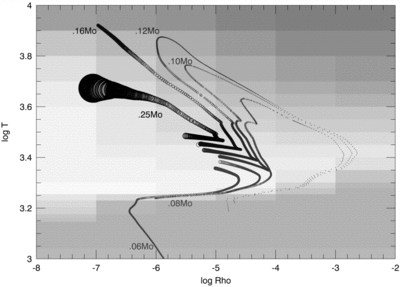
Caption: Fig. 6.
Photospheric evolution in the density‐temperature plane. The evolutionary sequences are plotted on top of the hydrogen‐rich opacity table. Darker shades of gray represent higher opacities. The size of the open circle representing a converged model is in proportion to the actual radius of the star. The stars begin their evolution on the Hayashi track, clustered fairly close together near the point log10T ≈ 3.3, log10ρ ≈ −5.5. Notice that the M* = 0.08 model slides all the way along the grain opacity boundary to a photospheric density log10ρ ≈ −5.5 before reaching the main sequence.
Other Images in This Article

Copyright and Terms & Conditions
© 1997. The American Astronomical Society. All rights reserved. Printed in U.S.A.

Copyright ©
2026 Astronomy Image Explorer. All Rights Reserved.
