Image Details
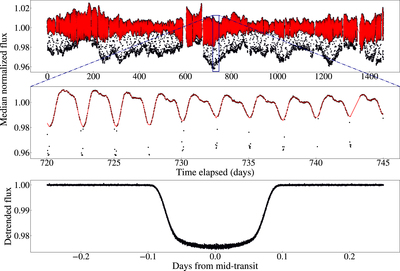
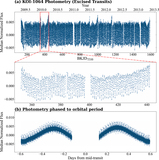
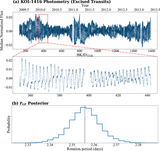
Caption: Figure 6.
Gaussian process detrending. The example above shows the detrending result for one-quarter of long-cadence data for KOI-1416. The out-of-transit photometric variability in the Kepler light curve can be modeled using a quasiperiodic kernel. The top panel shows the flux (black points) normalized to the median value, while the middle panel is a magnification to the region highlighted by the rectangle. The red line is the maximum a posteriori model. The bottom panel shows the phase-folded photometry, once the baseline found by the Gaussian process is removed. No additional processing (e.g., sigma clipping) is performed.
Other Images in This Article
Copyright and Terms & Conditions
© 2023. The Author(s). Published by the American Astronomical Society.