Image Details
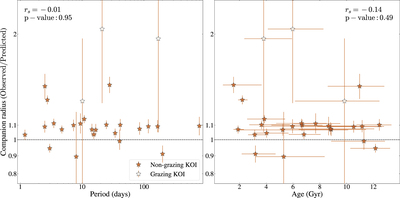
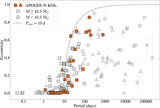
Caption: Figure 4.
The ratio between the measured radius and the predicted radius from the evolutionary models of Baraffe et al. (2015) and Marley et al. (2021) as a function of the period (left panel) and stellar age (right panel). In each panel, nongrazing KOIs are plotted as red stars, while grazing KOIs are shown as white stars. For clarity, KOI-2513 is not shown in this plot because of the large uncertainty on radius. Each system is compared to the prediction from evolutionary models at the median age determined from the SED fit. The Spearman correlation (r s ) and associated p-value are listed for each panel. On average, the observed radii are 9.1% larger than the predicted radii.
Other Images in This Article
Copyright and Terms & Conditions
© 2023. The Author(s). Published by the American Astronomical Society.