

Image Details
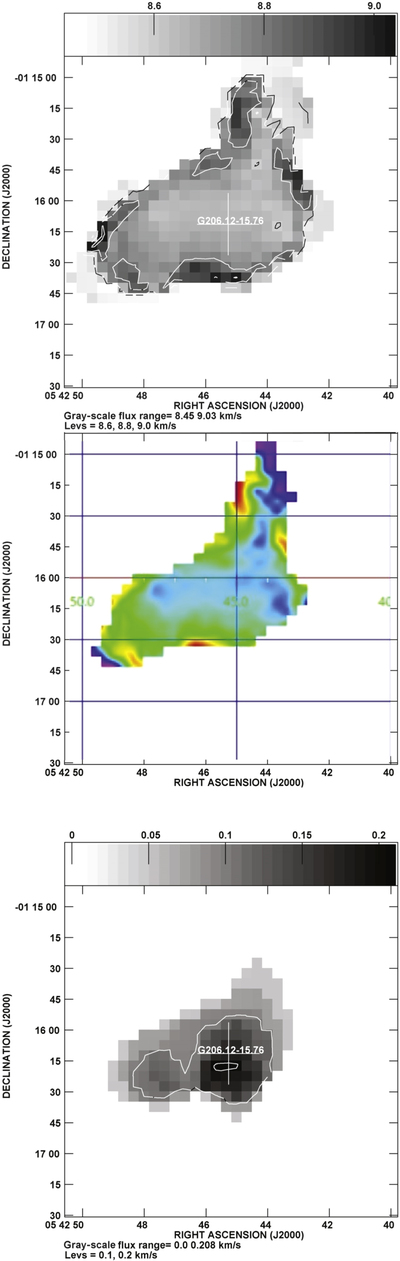
Caption: Figure 17.
The top and middle panels show the intensity-weighted velocity (moment 1) maps in gray scale and in pseudo-color, respectively, toward field G206.12 (Figure 2). The bottom panel shows the intensity-weighted velocity dispersion (moment 2) map in gray scale toward the same field.
Other Images in This Article
Show More
Copyright and Terms & Conditions
© 2021. The American Astronomical Society. All rights reserved.

Copyright ©
2026 Astronomy Image Explorer. All Rights Reserved.
