

Image Details
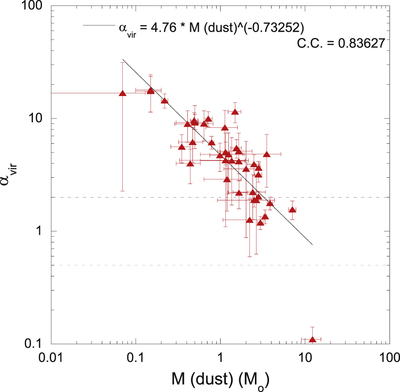
Caption: Figure 9.
Virial parameter αvir vs. M (dust). The straight line was computed using a least-squares program. C.C represents the correlation coefficient. The horizontal dotted lines represent αvir = 0.5 and 2.
Other Images in This Article
Show More
Copyright and Terms & Conditions
© 2021. The American Astronomical Society. All rights reserved.

Copyright ©
2026 Astronomy Image Explorer. All Rights Reserved.
