

Image Details
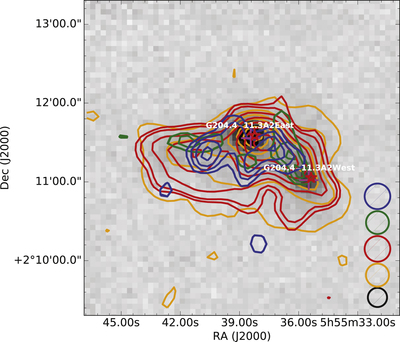
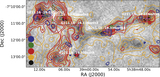
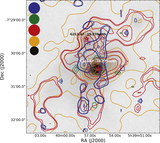
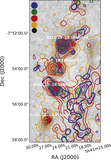
Caption: Figure 1.
NRO FOREST maps of N2H+ (orange), HC3N (red), CCS-H (green), and CCS-L (blue) integrated intensities overlaid on JCMT SCUBA-2 850 μm continuum emission, in gray scale, for field G204.4. The contours are drawn at 5%, 20%, 35%, 50%, 65%, 80%, and 95% of the peak value above 3σ, and also at 3σ. The respective σ and peak values of the integrated intensity are listed in Table A3. The circles represent the beam sizes with corresponding colors. The black circle, however, corresponds to the SCUBA-2 beam size. The crosses and stars represent a SCUBA-2 core and a protostar, respectively.
Other Images in This Article
Show More
Copyright and Terms & Conditions
© 2021. The American Astronomical Society. All rights reserved.

Copyright ©
2026 Astronomy Image Explorer. All Rights Reserved.
