

Image Details
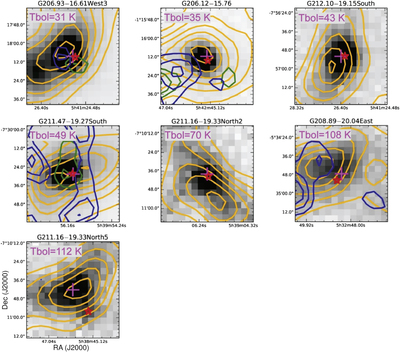
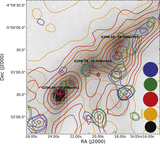
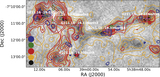
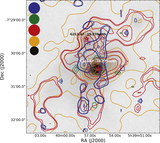
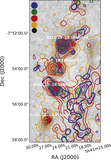
Caption: Figure 16.
Close-up maps sorted in order of evolutionary stages using Tbol for representative star-forming cores. Each map represents the integrated-intensity contour map superposed on the 850 μm dust continuum emission map. The orange, green, and blue contours represent the N2H+, CCS-H, and CCS-L integrated-intensity contour maps, respectively. The innermost to outermost contour levels correspond to 95%, 80%, 65%, 50%, 35%, 20%, 5%, and 3σ, respectively. The σ and peak values of integrated intensity are listed in Table A3. The cross and stars represent a SCUBA-2 core and a protostar, respectively. The error for Tbol is listed in Table A2 in the appendix.
Other Images in This Article
Show More
Copyright and Terms & Conditions
© 2021. The American Astronomical Society. All rights reserved.

