Image Details
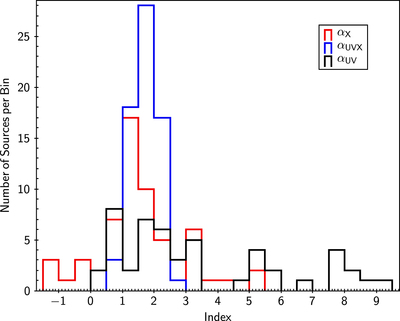
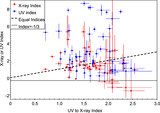
Caption: Figure 7.
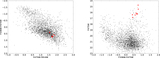
The distributions of X-ray PL spectral index (red histogram), UV to X-ray index (blue histogram), and UV index (black histogram). For X-ray index and UV to X-ray index the fits were to 2 bands, so all sources with data are included. For the UV index, sources which had poor PL fits (χ2 > 3) were excluded.
Other Images in This Article
Copyright and Terms & Conditions
© 2020. The American Astronomical Society. All rights reserved.
Copyright ©
2024 Astronomy Image Explorer. All Rights Reserved.