Image Details
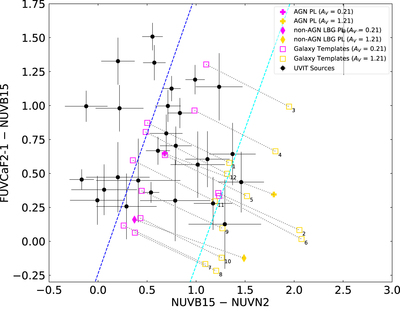
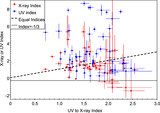
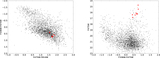
Caption: Figure 4.
UV color–color diagram with FUVCaF2 − NUVB15 vs. NUVB15 − NUVN2 for the lower left region of the previous figure. The calculated points assuming the counterparts of the X-ray sources are background galaxies behind M31 are plotted. The series of galaxy spectrum templates are from the Kinney–Calzetti Spectal Atlas of Galaxies at STScI. For AGNs and non-AGN Lyman-break galaxies (Hainline et al. 2011), the spectrum is PL Fλ ∝ λβ, with indices of β = −0.314 and β = −1.49, respectively. Template galaxy spectra labeled 1–12 are: elliptical, bulge, S0, Sa, Sb, Sc, starburst with E(B − V) < 0.1, starburst with 0.11 < E(B − V) < 0.21, starburst with 0.25 < E(B − V) < 0.35, starburst with 0.39 < E(B − V) < 0.50, starburst with 0.51 < E(B − V) < 0.60, and starburst with 0.61 < E(B − V) < 0.70. The BB models from Figure 3 for various temperatures are connected by the dotted lines, with AV = 0.21 (blue line) and AV = 1.21 (cyan line). For this range of FUVCaF2 − NUVB15 colors, the region covered by C-K stellar models is nearly the same as for BB models.
Other Images in This Article
Copyright and Terms & Conditions
© 2020. The American Astronomical Society. All rights reserved.