Image Details
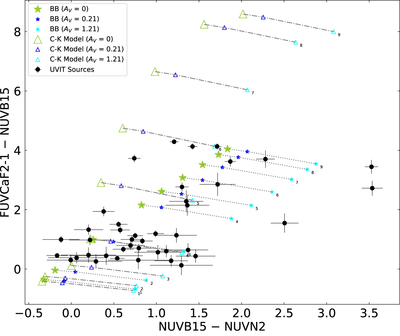
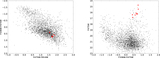
Caption: Figure 3.
UV color–color diagram with FUVCaF2 − NUVB15 vs. NUVB15 − NUVN2. The data are plotted as black circles with error bars. Model points are calculated for a series of BB (star symbols) and stellar models (triangles, labeled C-K; Castelli & Kurucz 2003). The labels, temperatures, and corresponding spectral types are: (i) 45,000 K O5V; (ii) 30,000 K B0V; (iii) 15,000 K B5V; (iv) 9500 K A0V; (v) 8200 K A5V; (vi) 7200 K F0V; (vii) 6400 K F5V; (viii) 6000 K G0V; and (ix) 5700 K G5V. Extinctions of AV = 0 (green), AV = 0.21 (blue), and AV = 1.21 (cyan) are plotted for each model, connected by dotted lines.
Other Images in This Article
Copyright and Terms & Conditions
© 2020. The American Astronomical Society. All rights reserved.
Copyright ©
2024 Astronomy Image Explorer. All Rights Reserved.