Image Details
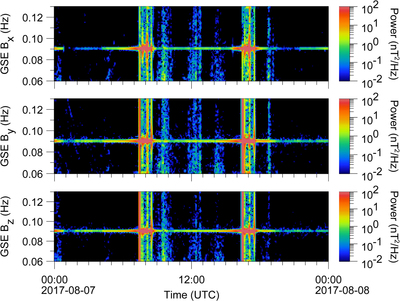
Caption: Figure 3.
Plot of power in Bx (top panel), By (middle panel), and Bz (bottom panel) in GSE coordinates as a function of frequency and time for Van Allen Probe A for 2017 August 7. The spectrograms are a stack of power spectra calculated successively for intervals of 16 minutes. The power is estimated using a sliding Hann window that overlaps three-fourths of each successive data segment. Time is given on the horizontal axis and frequency on the vertical. The domain of frequencies is restricted to those about the spacecraft spin frequency near 0.09 Hz. The spectral power is indicated by color. A peak is evident at the spacecraft spin frequency. Power in the peak modulates as the spacecraft travels through regions of larger B near Earth. Sharp changes occur as the range changes near perigee at 08:00 and 17:00 UTC, and the background power is elevated. Broadband pulsations are evident at times due to magnetospheric activity. In the calibration to the spinning-spacecraft frame, the daily values for ﹩{{\boldsymbol{B}}}_{0}﹩ and ﹩\overleftrightarrow{A}﹩ were averaged over 11 days and then applied to this day of the data. The limiting accuracy for the spin-axis sensor orientation is 1 part in 4000. In GSE coordinates, Bx corresponds nearly with the spin axis.
Other Images in This Article
Copyright and Terms & Conditions
© 2020. The American Astronomical Society. All rights reserved.