Image Details
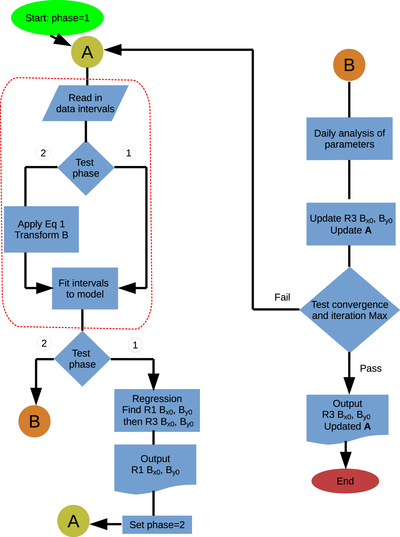
Caption: Figure 1.
Basic algorithm for the calibration of raw sensor data to corrected ﹩{\boldsymbol{B}}﹩. Range 1 data denoted by R1 and range 3 by R3. The algorithm begins in phase 1 at entry point A on the left-hand side and then proceeds downward to process intervals in the portion within the dotted rounded rectangle signifying that the data are read and processed in small intervals and looped over all intervals during the day analyzed. In phase 1, raw values are used to establish the bias and afterward return to point A in phase 2 where the transformed value of ﹩{\boldsymbol{B}}﹩ is employed in the interval analysis. In phase 2, the algorithm moves to entry point B on the right-hand side for the daily analysis that updates range 3 bias and the matrix ﹩\overleftrightarrow{A}﹩. If not converged or not at maximum iteration value, the process is repeated. The analysis of intervals is by direct calculation of model-fitting constants, and iteration is only carried out for the calibration as a whole.
Other Images in This Article
Copyright and Terms & Conditions
© 2020. The American Astronomical Society. All rights reserved.