Image Details
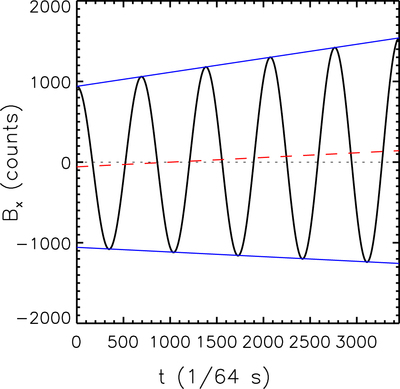
Caption: Figure 2.
Schematic of Bx (solid black line) in the spinning-spacecraft frame as a function of t in a subinterval with T = 3454 and 5 cycles. Solid blue lines pass through extrema, and the line of bias is given by the dashed red line. The level dotted line has Bx = 0. The upper blue line extends from maximum at t = 0 to the maximum at t = T. Six maxima are included. The lower blue line includes the five minima and is extended to the end points of the subinterval. The extrema lines diverge with increasing t, corresponding to an increasing amplitude of Bx. The difference of the slopes of the extrema lines is the amount of change in amplitude. The difference of their intercepts with t = 0 divided by 2 is the amplitude. The sum of the extrema lines divided by 2 is the line bias. The slope of the line of bias arises from the change in the spin-axis component of ﹩{\boldsymbol{B}}﹩ that is projected upon the X sensor. In the limit of complete correction, the transformed Bx will have the red dashed line coincident with the level dotted line. The range of Bx and the value of T are typical of Van Allen Probe data. Slopes are exaggerated compared to range 1 data but comparable in range 3.
Other Images in This Article
Copyright and Terms & Conditions
© 2020. The American Astronomical Society. All rights reserved.