Image Details
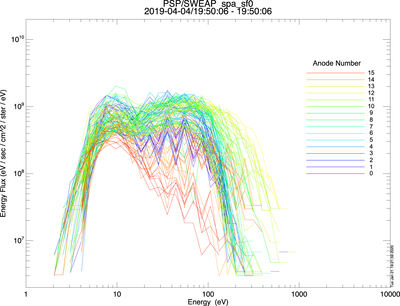
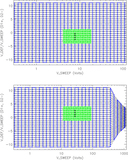
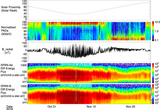
Caption: Figure 13.
A plot of each angular (phi by theta) bin response as a function of energy. The sawtooth pattern seen in the red and purple corresponds to extreme theta deflection angles and outer phi pixels, and it indicates a difference in measurement with different deflection sweeping direction.
Other Images in This Article

Show More
Copyright and Terms & Conditions
© 2020. The Author(s). Published by the American Astronomical Society.
Copyright ©
2025 Astronomy Image Explorer. All Rights Reserved.