Image Details
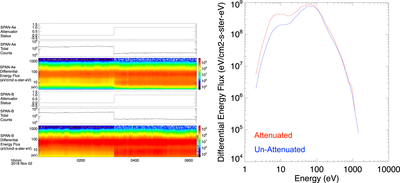
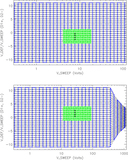
Caption: Figure 10.
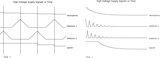
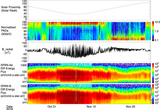
Left panel: time-series plot of the SPAN-E mechanical attenuators being engaged in the first encounter. Top to bottom: attenuator Status, SPAN-Ae, Total Counts per accumulation period, SPAN-Ae (generated onboard instrument), Summed Energy Spectra for SPAN-Ae, Attenuator Status, SPAN-B, Total Counts per accumulation period, SPAN-B (generated onboard instrument), and Summed Energy Spectra for SPAN-B. The attenuator moves to the “In” position at approximately 0310, with ground software constructing an artificial increase in “background” electron flux thereafter. Right panel: single energy spectrum produced by SPAN-Ae before (blue) and after (red) the mechanical attenuator is engaged (same time period). An artificial increase in electron flux below approximately 25 eV is apparent.
Other Images in This Article
Show More
Copyright and Terms & Conditions
© 2020. The Author(s). Published by the American Astronomical Society.