Image Details
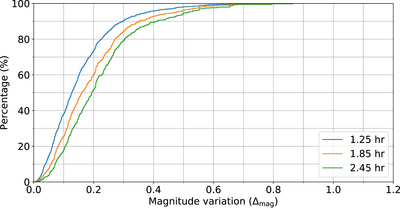
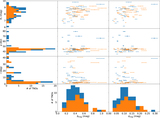
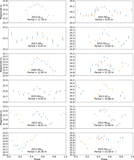
Caption: Figure 9.
Cumulative distribution of the magnitude variation (the maximum minus the minimum: ﹩{{\rm{\Delta }}}_{\mathrm{mag}}﹩) within 1.25 hr (blue, top), 1.85 hr (orange, middle), and 2.45 hr (green, bottom) sections of light curves.
Other Images in This Article
Show More
Copyright and Terms & Conditions
© 2019. The American Astronomical Society. All rights reserved.
Copyright ©
2025 Astronomy Image Explorer. All Rights Reserved.