Image Details
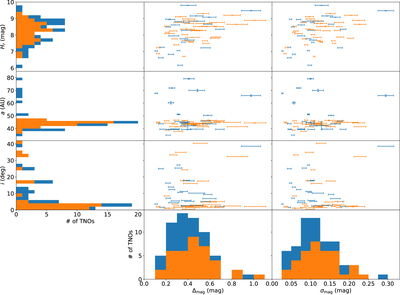
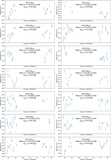
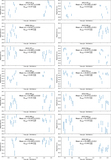
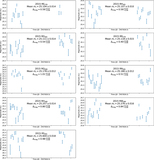
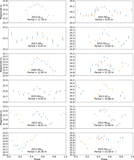
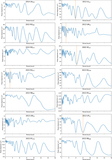
Caption: Figure 7.
Left and bottom sides: histograms of Hr magnitude, semimajor axis a, inclination i, ﹩{{\rm{\Delta }}}_{\mathrm{mag}}﹩, and ﹩{\sigma }_{\mathrm{mag}}﹩ of our data. Center and top right: scatter plots of these parameters. Classical TNOs are shown in orange, and nonclassical objects are shown in blue.
Other Images in This Article
Show More
Copyright and Terms & Conditions
© 2019. The American Astronomical Society. All rights reserved.
Copyright ©
2025 Astronomy Image Explorer. All Rights Reserved.