Image Details
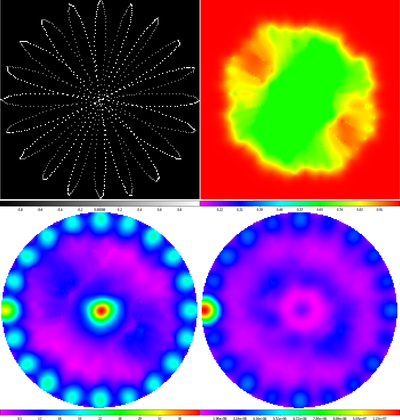
Caption: Figure 53.
Top left: path map of the 20 m X-band daisy from Figures 25 and 44. This is a 20 petal daisy, though the user may select as few as four petals (however, see Section 4). The path began and ended on the left edge, and some points, particularly near the center, have been removed by the RFI-subtraction algorithm. Scans alternate between white and gray. Top right: the corresponding scale map for our default minimum weighting scale of θmin = 2/3 beamwidths (Equation (14)), which can be compared to the top-right panel of Figure 49, where θmin = 0 beamwidths. This is the scale map that was used to surface-model Figure 44. The exterior yellow, orange, and red regions, corresponding to θw > 3/4 beamwidths, are not appropriate for photometry, but this is not a problem because the source does not extend this far out (Figure 44). Bottom left: weighted number of data points that contributed to each pixel when surface-modeling Figure 44, given the path map and the scale map. Extra data were acquired at the telescope’s start/stop position, on the left edge. Bottom right: the full weight map, which includes weights for each of the post-RFI subtraction values that were fitted to when surface-modeling Figure 44. Less information informs these values in the vicinity of the source. Weight maps are important (1) when stacking images, since not all regions are equally well determined, and (2) when doing photometry, both when determining the background level and when calculating error bars.
Other Images in This Article


Show More
Copyright and Terms & Conditions
© 2019. The American Astronomical Society. All rights reserved.