Image Details
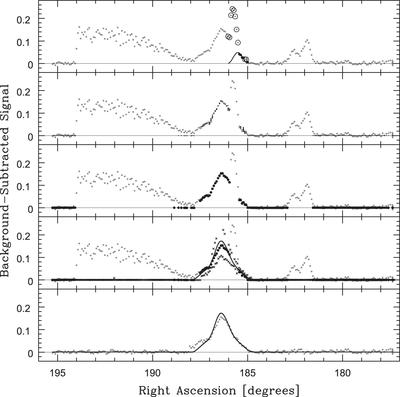
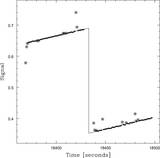
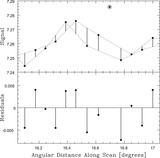
Caption: Figure 32.
First panel: 1D cross-section, along a scan, of a 2D local model, centered on an arbitrary point from the left panel of Figure 23, near Virgo A (curve). We have contaminated this scan with three instances of simulated RFI (the original, uncontaminated data are plotted in the fifth panel). Circled points have been iteratively rejected as too high, given the modeled noise level (Section 3.5); the larger, darker points were not rejected. Second panel: every local model that intersects this scan, evaluated at each local model’s non-rejected points (smaller, darker points). All instances of simulated RFI have been rejected as too narrow, either along this scan or across adjacent scans, compared to the RFI-subtraction scale (in this case, θRFI = 0.9 beamwidths; Table 2). Third panel: global model, constructed from the local-model values (larger, darker points). Fourth panel: 1D cross-section of the 2D surface model (Section 1.2.2; see Section 3.7), constructed from the 2D global model, three scans of which are shown (this scan = larger, darker points; adjoining scans = crosses). Differences between data and model are due primarily to residual en-route drift, which differs from scan to scan. Fifth panel: the same, but constructed from the original, uncontaminated data, demonstrating the effectiveness of this approach to RFI subtraction.
Other Images in This Article


Show More
Copyright and Terms & Conditions
© 2019. The American Astronomical Society. All rights reserved.