Image Details
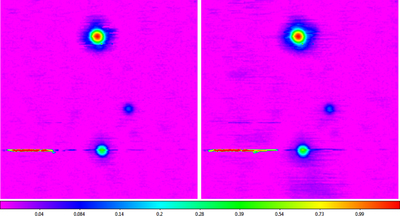
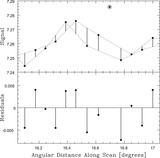
Caption: Figure 23.
20 m L-band raster from Figure 5 background-subtracted, with 7 (left; Table 1) and 24 (right) beamwidth scales (the map is 24 beamwidths across). Locally modeled surfaces (Section 1.2.1, see Section 3.7) have been applied for visualization only. Hyperbolic arcsine scaling is used to emphasize fainter structures.
Other Images in This Article


Show More
Copyright and Terms & Conditions
© 2019. The American Astronomical Society. All rights reserved.
Copyright ©
2025 Astronomy Image Explorer. All Rights Reserved.