Image Details
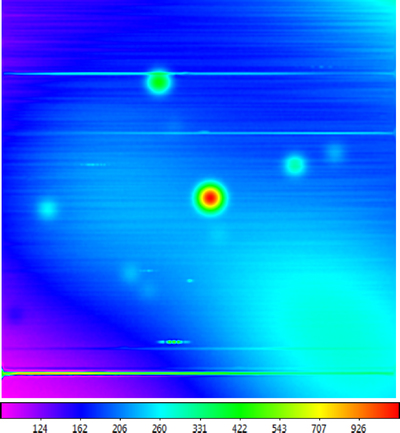
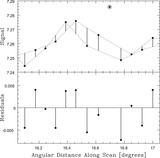
Caption: Figure 21.
Simulated data from Figure 18 to which we have added large-scale astronomical and elevation-dependent signal. For the large-scale astronomical signal, we use a sum of 2D Gaussian distributions, each with an FWHM of ≈12 beamwidths. For the elevation-dependent signal, we use a cosecant function. As in Figure 5, elevation is decreasing toward the upper right. A locally modeled surface (Section 1.2.1; see Section 3.7) has been applied for visualization only. Hyberbolic arcsine scaling is used to emphasize fainter structures.
Other Images in This Article


Show More
Copyright and Terms & Conditions
© 2019. The American Astronomical Society. All rights reserved.
Copyright ©
2025 Astronomy Image Explorer. All Rights Reserved.