Image Details
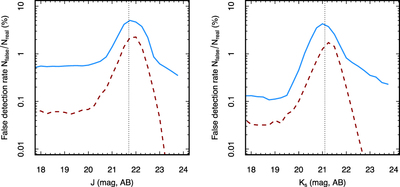
Caption: Figure 8.
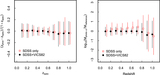
False-detection rates ﹩{N}_{\mathrm{false}}/{N}_{\mathrm{real}}﹩ as a function of magnitude. The false-detection rates were determined by inverting subimages and running the source extraction as described in Section 2.4 (further details of the method are provided in Section 2.7). Any “sources” detected in these inverted images are noise spikes meeting the detection criteria; for Gaussian noise this will correspond to the expected number of false positives at a given flux level in the real catalog. The vertical line in each panel marks the average 5σ limit of the survey in each band. The false-detection rates at this limit are 2.3% (CFHT, dashed line) and 4.6% (VISTA, solid line) in J and 1.4% (CFHT) and 2.6% (VISTA) in ﹩{K}_{{\rm{s}}}﹩.
Other Images in This Article

Copyright and Terms & Conditions
© 2017. The American Astronomical Society. All rights reserved.