Image Details
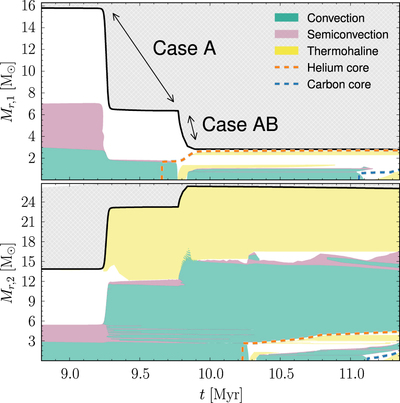
Caption: Figure 7.
Kippenhahn diagram for the evolution of a ﹩16\;{{\rm{M}}}_{\odot }+14\;{{\rm{M}}}_{\odot }﹩ system with a 3 day initial orbital period. Most of the pre-interaction phase is not shown in this figure. The upper plot shows the evolution of the donor, while the lower plot displays that of the accretor.
Other Images in This Article


Show More
Copyright and Terms & Conditions
© 2015. The American Astronomical Society. All rights reserved.
Copyright ©
2025 Astronomy Image Explorer. All Rights Reserved.