Image Details
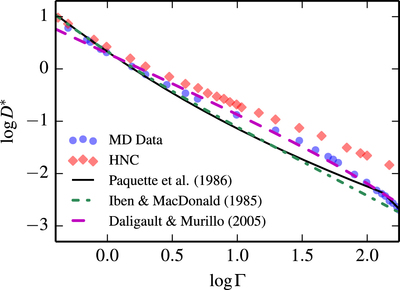
Caption: Figure 44.
Compilation of the self-diffusion coefficients obtained from different methods. “MD Data” and “HNC” points are taken from Baalrud & Daligault (2013). The solid black line is the result of the MESA calculation using the coefficients of Paquette et al. (1986). The dashed green line is the result of the calculation using the resistance coefficients from the original routine of Thoul et al. (1994) based on the fit to the Coulomb logarithm found in Iben & MacDonald (1985), given here in Equation (96). The dashed purple line represents the fit to MD data given here in Equation (112).
Other Images in This Article


Show More
Copyright and Terms & Conditions
© 2015. The American Astronomical Society. All rights reserved.
Copyright ©
2025 Astronomy Image Explorer. All Rights Reserved.