Image Details
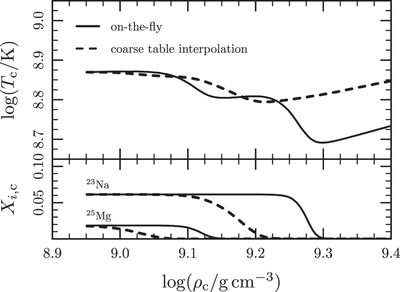
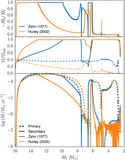
Caption: Figure 37.
Top panel shows the evolution of ﹩{T}_{{\rm{c}}}﹩ and ﹩{\rho }_{{\rm{c}}}﹩ in an 8.8 ﹩{M}_{\odot }﹩ star. The bottom panel shows the central ﹩{}^{25}\mathrm{Mg}﹩ and ﹩{}^{23}\mathrm{Na}﹩ mass fractions. The solid lines show the evolution using the on-the-fly rates, the dashed lines show the results when interpolating in coarse tables. The locations of the changes in mass fraction match the locations of cooling in the top panel. This demonstrates the importance of densely sampled weak rates to the evolution of the core.
Other Images in This Article


Show More
Copyright and Terms & Conditions
© 2015. The American Astronomical Society. All rights reserved.
Copyright ©
2025 Astronomy Image Explorer. All Rights Reserved.