Image Details
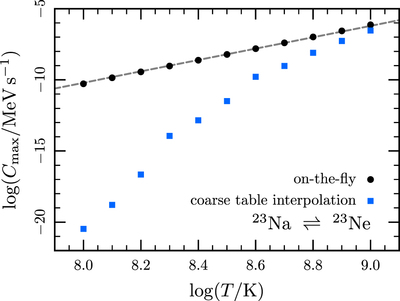
Caption: Figure 36.
Effect of the interpolation method on the Urca process cooling rates. The circles show the maximum value of C (Equation (79)) calculated using the on-the-fly methods discussed in this section; the squares show the results using the coarse tables of Oda et al. (1994). Interpolation in these coarse tables severely underestimates the Urca cooling rates at low temperatures. The dashed line shows the expected value of the cooling rate given by Equation (80).
Other Images in This Article


Show More
Copyright and Terms & Conditions
© 2015. The American Astronomical Society. All rights reserved.
Copyright ©
2025 Astronomy Image Explorer. All Rights Reserved.