Image Details
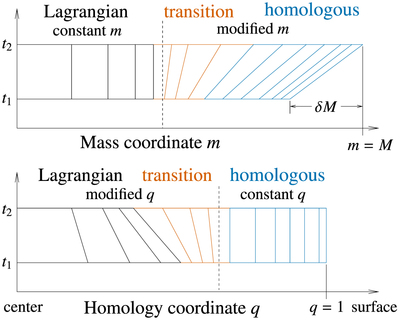
Caption: Figure 32.
Illustration of the MESAstar mesh in both m and q for a timestep in which mass is added to the star over the time interval t1 to t2. Vertical and slanted lines indicate cell boundaries. Cell size is exaggerated; there can be many cells in the newly added material. Three regions are chosen in the process of expanding the mesh for the added material, an inner Lagrangian region, an outer homologous region, and a transition region.
Other Images in This Article


Show More
Copyright and Terms & Conditions
© 2015. The American Astronomical Society. All rights reserved.
Copyright ©
2025 Astronomy Image Explorer. All Rights Reserved.